

2020 - 2022
This is my second attempt to make an LED music visualizer. You can read about my first attempt here: Music Visualizer 1.
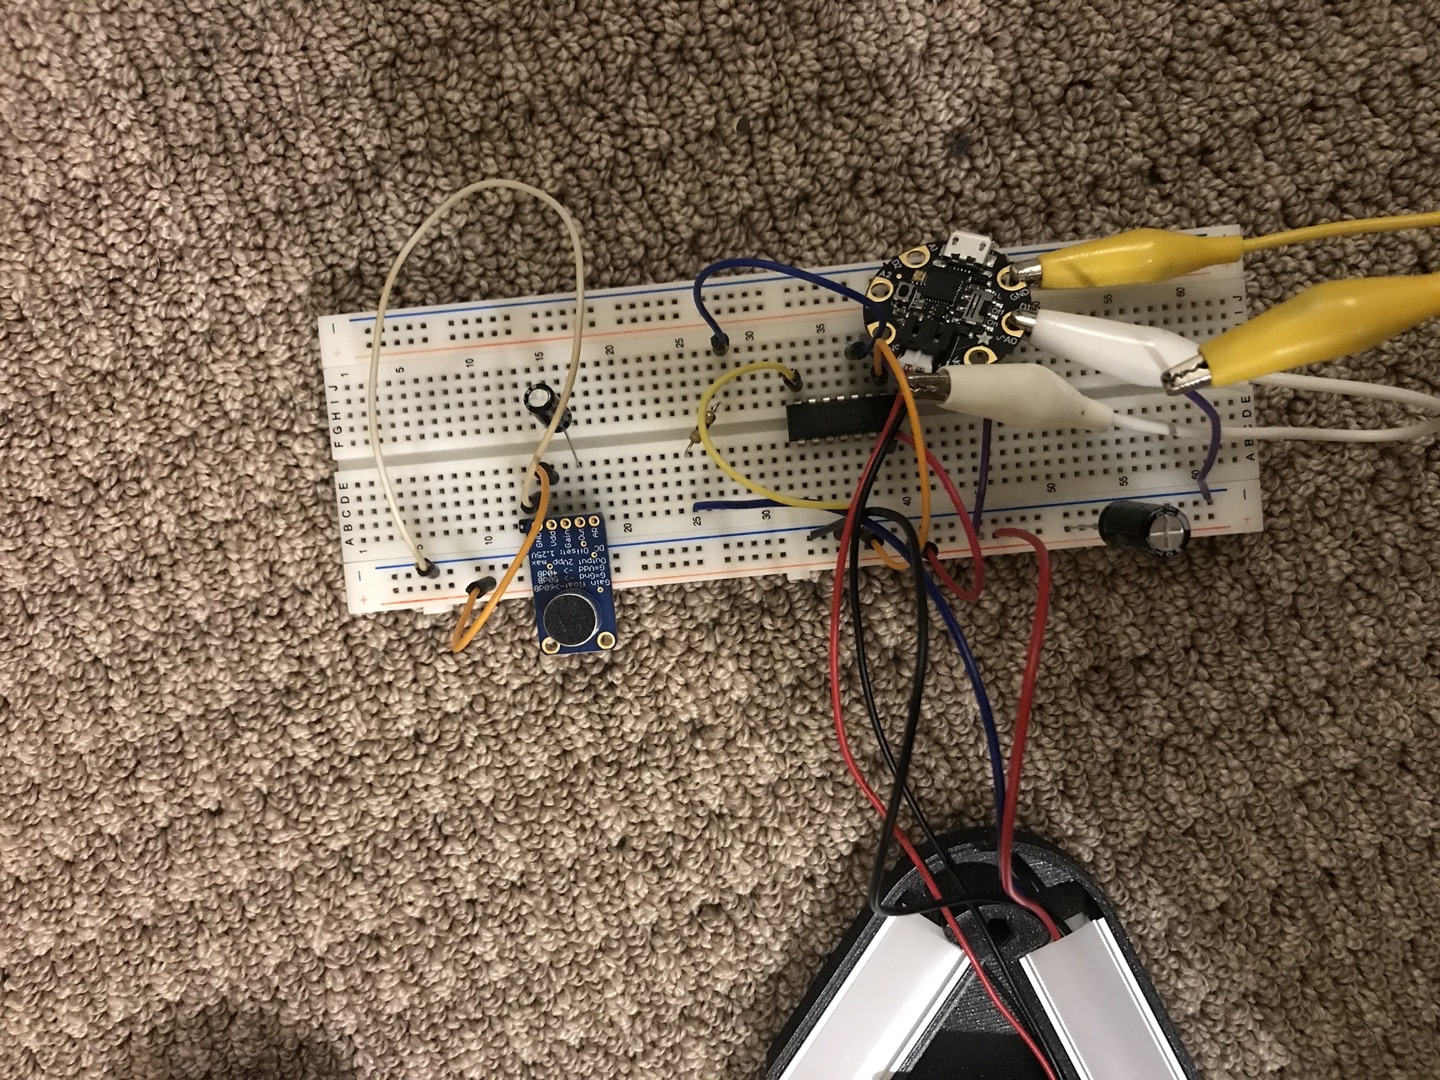
I leaned heavily on parts sold by Adafruit. Their excellent learning materials and documentation make it very easy for someone like me who has limited experience with electronics.
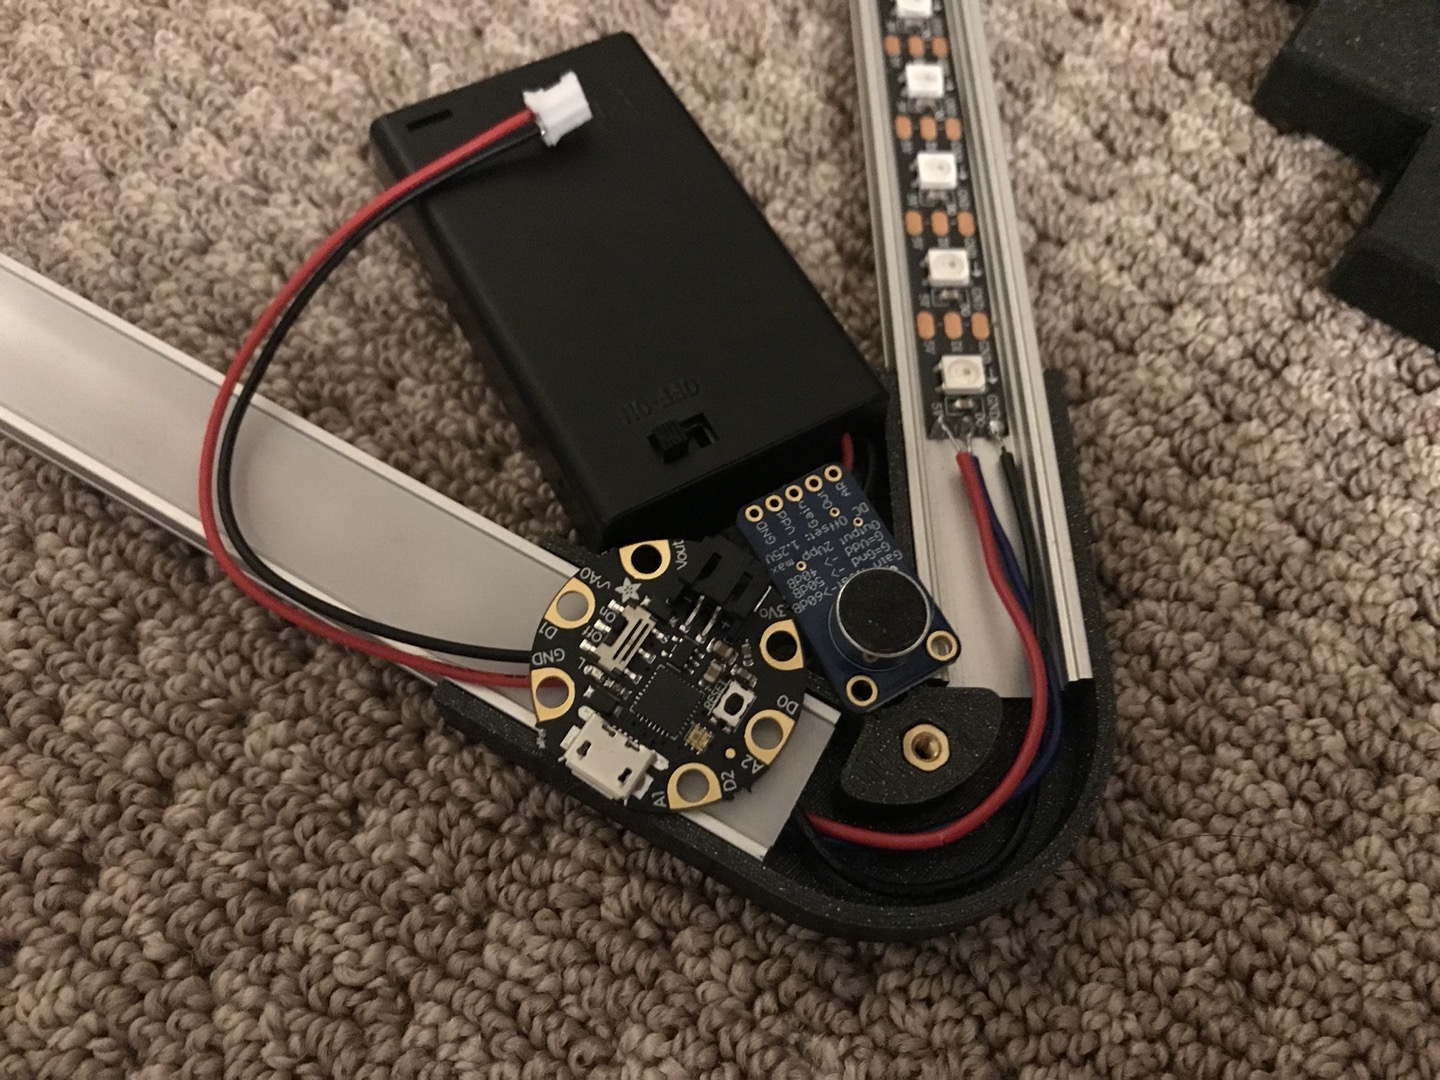
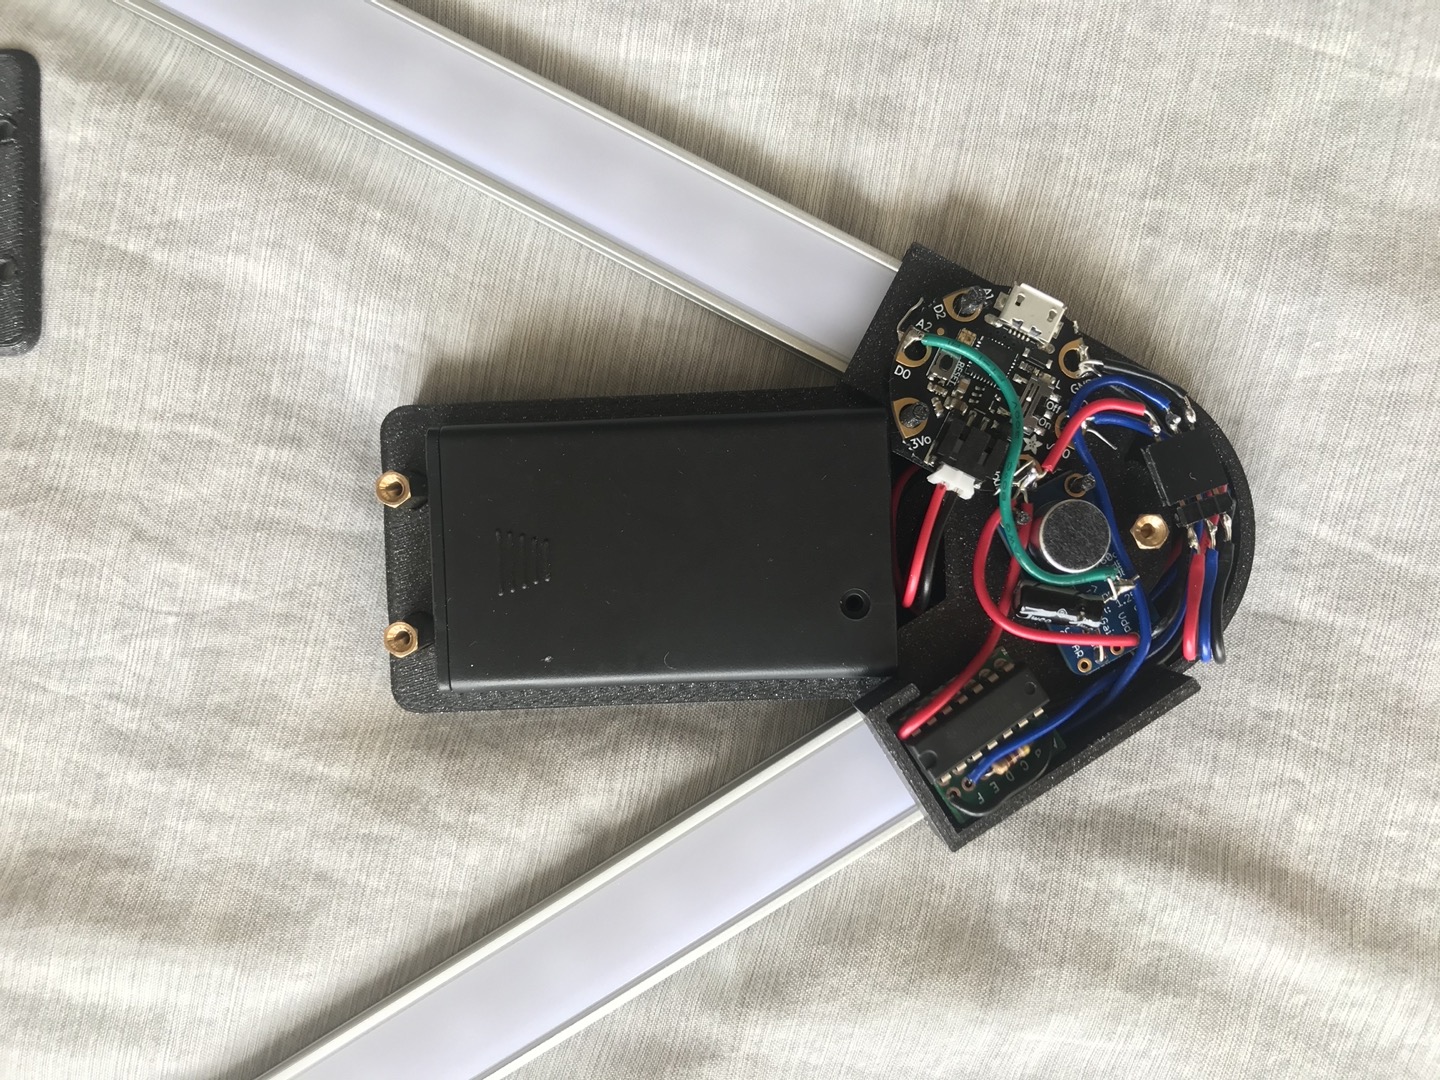
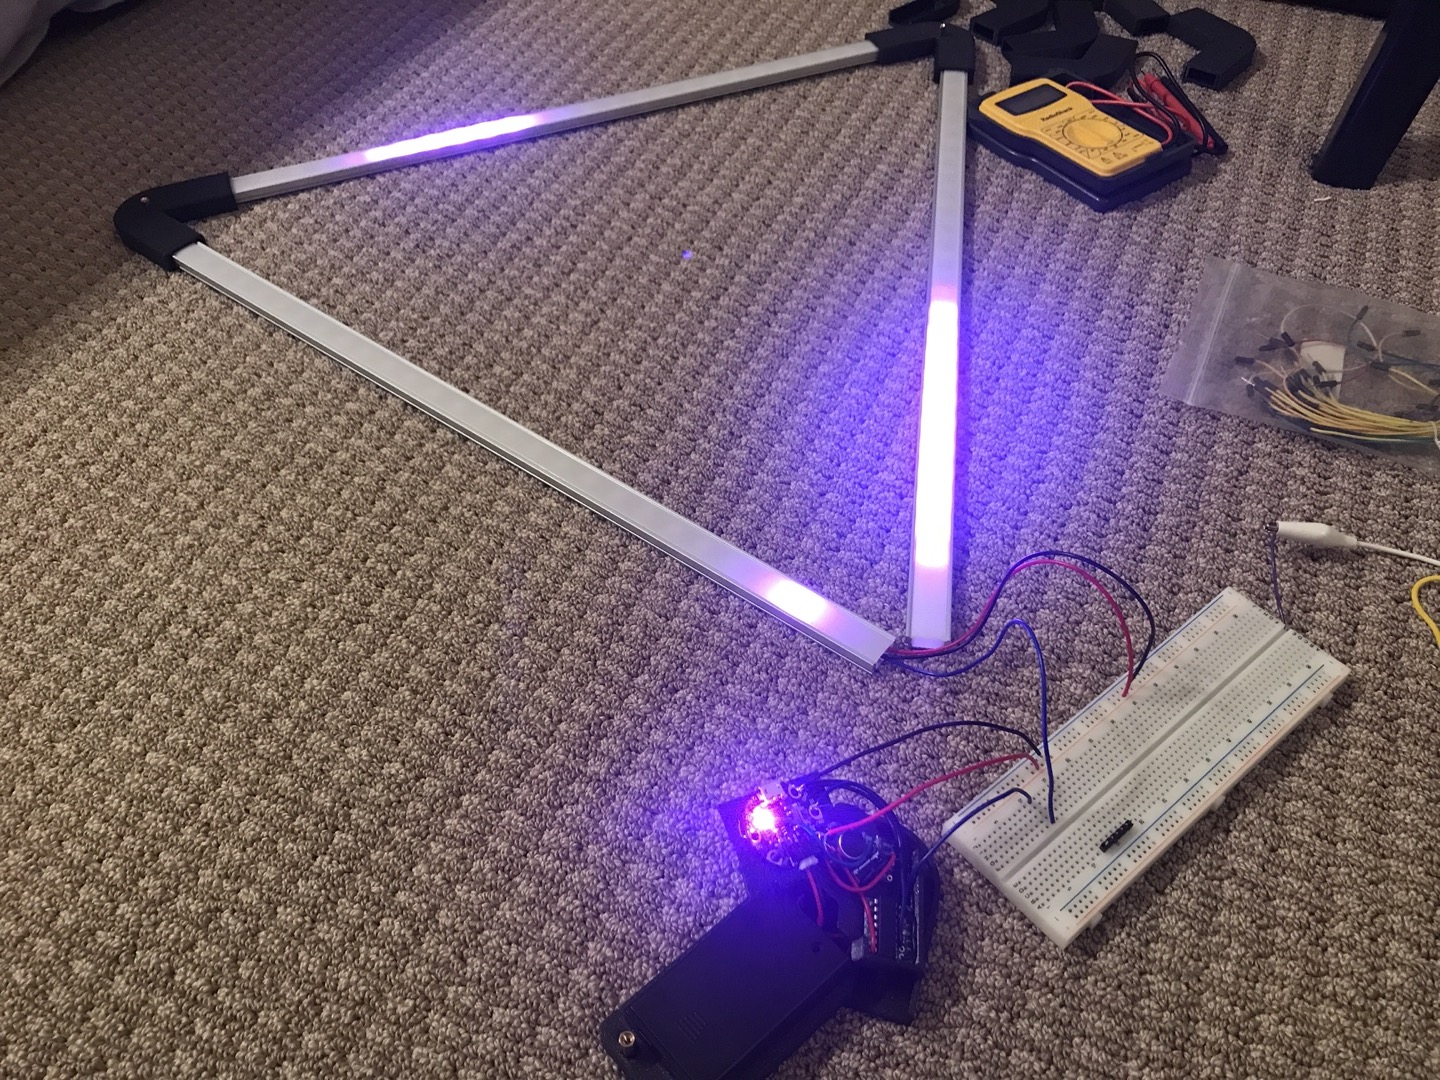
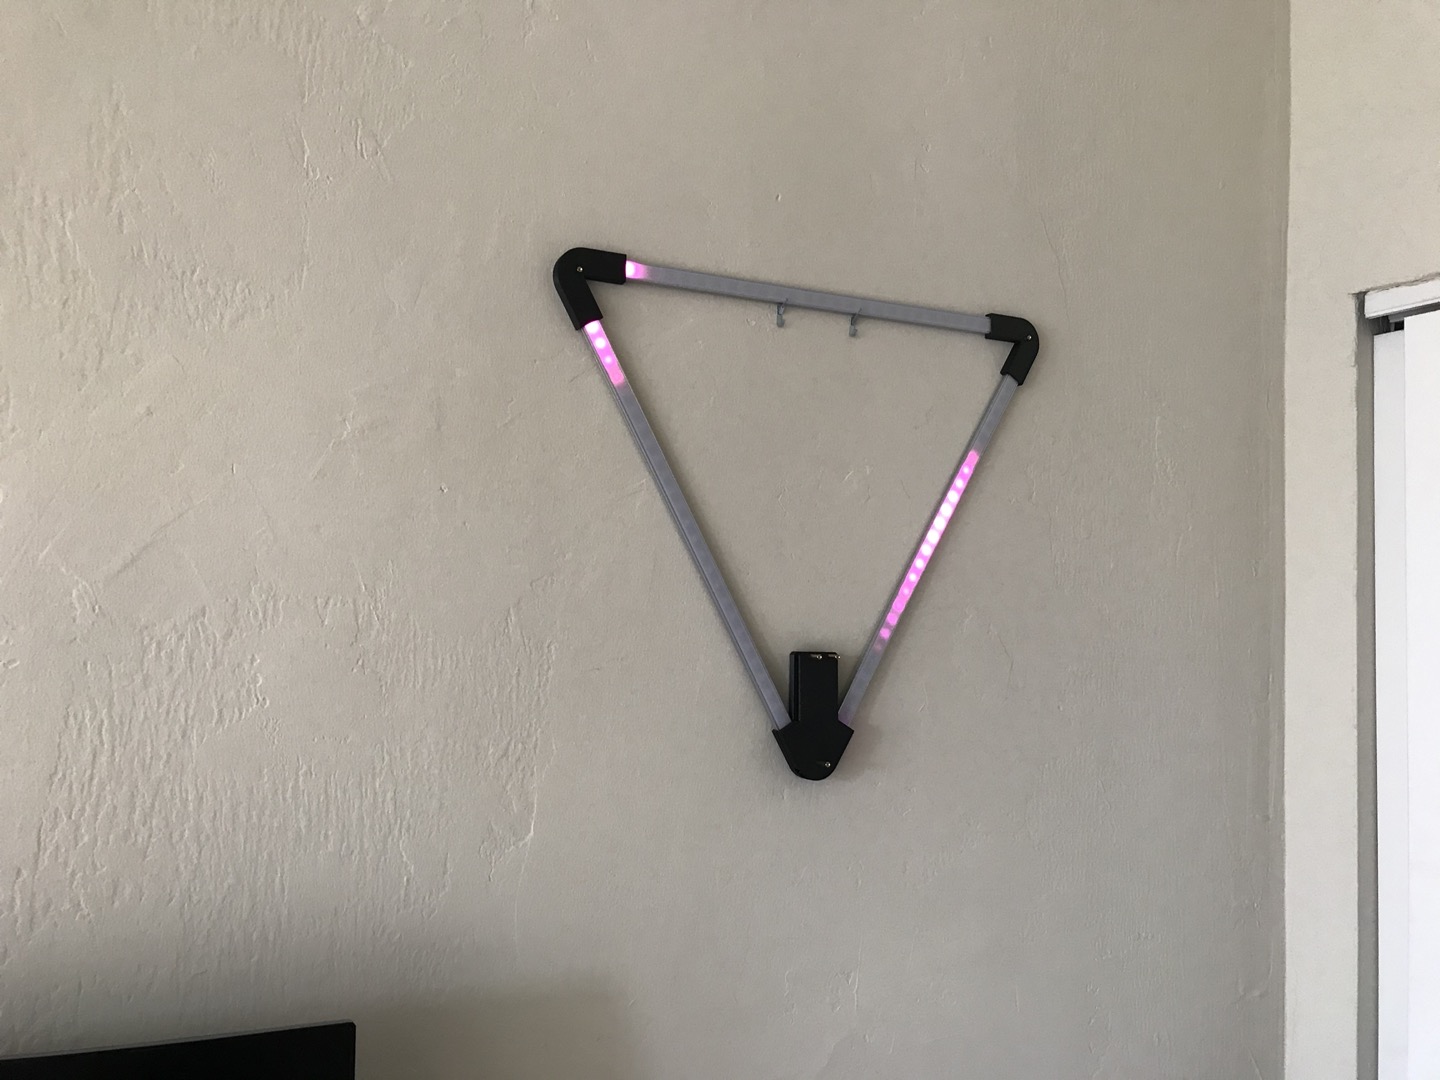
Music Visualizer 1 was just a bunch of LED strips stuck to a balsa wood sheet with wires and circuitry exposed. For Music Visualizer 2, I put the LED strips into aluminum channels with translucent covers to diffuse the light. The channels are arranged in a triangle, fastened together by 3D-printed PLA joints. The control unit sits in the bottom joint.
My original plan was to arrange the channels in a hexagon, but I had trouble keeping channels fastened together with my small printed joints. I couldn’t figure out a way to keep the device from falling apart short of using adhesives or drilling holes into the channels. So I simplified the layout to a triangle, which is much easier to keep together. Maybe I’ll revisit the hexagon layout in the future. Or maybe add an extra dimension and make a cube!
The triangle isn’t winning any design awards but it’s way better than raw LED strips slapped onto cheap sheet of wood!
Music Visualizer 1’s audio analysis was just a bunch of heuristics watching the audio wave amplitude over time. It tried to detect “beats” by looking for large changes in the amplitude.
Music Visualizer 2 goes a little deeper, using a FFT to analyze the input audio in the frequency domain. The signal is divided into 6 frequency ranges. Each range controls a half of an edge of the triangle. The top edge roughly responds to low frequencies, the right to mid-range frequencies, and the left to high frequencies. An edge lights up when its corresponding frequency range has a spike of activity.
The Cortex-M0 CPU on the Gemma M0 board has no floating-point unit. The arduino environment supports emulated floating point operations but those are too slow to run a fourier transform in real time. To get the audio analysis to run with acceptable performance I implemented a fast fourier transform that acts on 16-bit fixed point numbers with 8 fraction bits. I was able to get it to do transforms of an 128 sample buffer at 60 Hz. An assembly wizard could probably wring out even more performance.
Music Visualizer 2 runs on AAA batteries, so it doesn’t need to be plugged in.